Market Theory 101: Game Theory Meets Auctions
I like to look at markets as a combination of Game Theory and Auction Market Theory functioning together in one framework — explaining why markets move, and why they pause.
Over time I've found that Game Theory and Auction Market Theory together give me the clearest picture of what's actually happening on a chart. Not indicators, not patterns — but who is playing, what their incentives are, and how the auction facilitates their game.
This isn't a textbook repeat of either theory. It's how I personally combine them — focusing on the participants, what drives their behavior, and why balance and imbalance are the only two states that truly matter.
The Market Is a Game
Markets are a game of incentives, decisions, and reactions. Every participant is simultaneously deciding whether to cooperate, compete, or exploit.
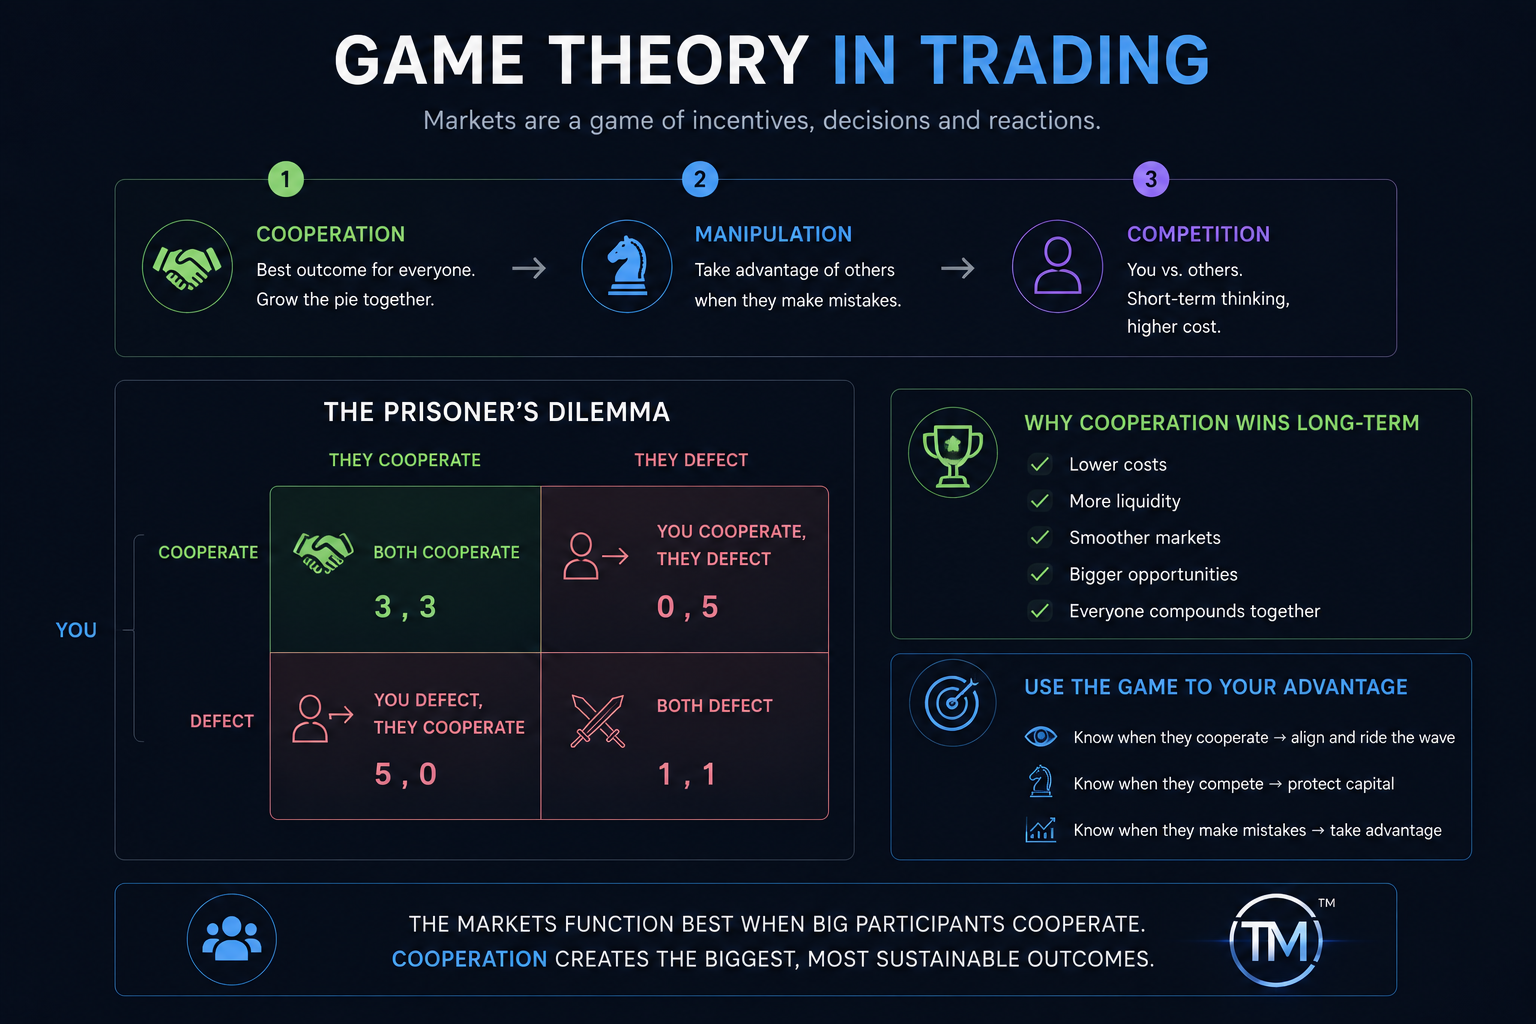
Three Modes of Play
1. Cooperation
Best outcome for everyone. Grow the pie together.
2. Manipulation
Sometimes the Larger Player takes advantage of the Medium Player if they make mistakes or try to outsmart others.
3. Competition
Large Titans compete & fight. In war, everyone loses or one wins at very big costs.
The Prisoner's Dilemma in Markets
The classic payoff matrix applies directly: when both sides cooperate (3,3), everyone benefits sustainably. When one defects while the other cooperates (5,0), the defector wins short-term but destroys trust. When both defect (1,1), everyone loses — high friction, thin liquidity, unpredictable moves.
Cooperation creates the biggest, most sustainable outcomes. This is why markets spend most of their time in balance — the big participants are cooperating, and everyone compounds together. Imbalance happens when someone defects.
Use the Game to Your Advantage
- → Know when they cooperate — align and ride the wave
- → Know when they compete — protect capital
- → Know when they make mistakes — take advantage
Big Fish, Small Fish
To utilize Game Theory in markets, I first need to know who's playing. The market is an ecosystem of participants with vastly different size, timeframe, and influence — and each tier plays the game differently.
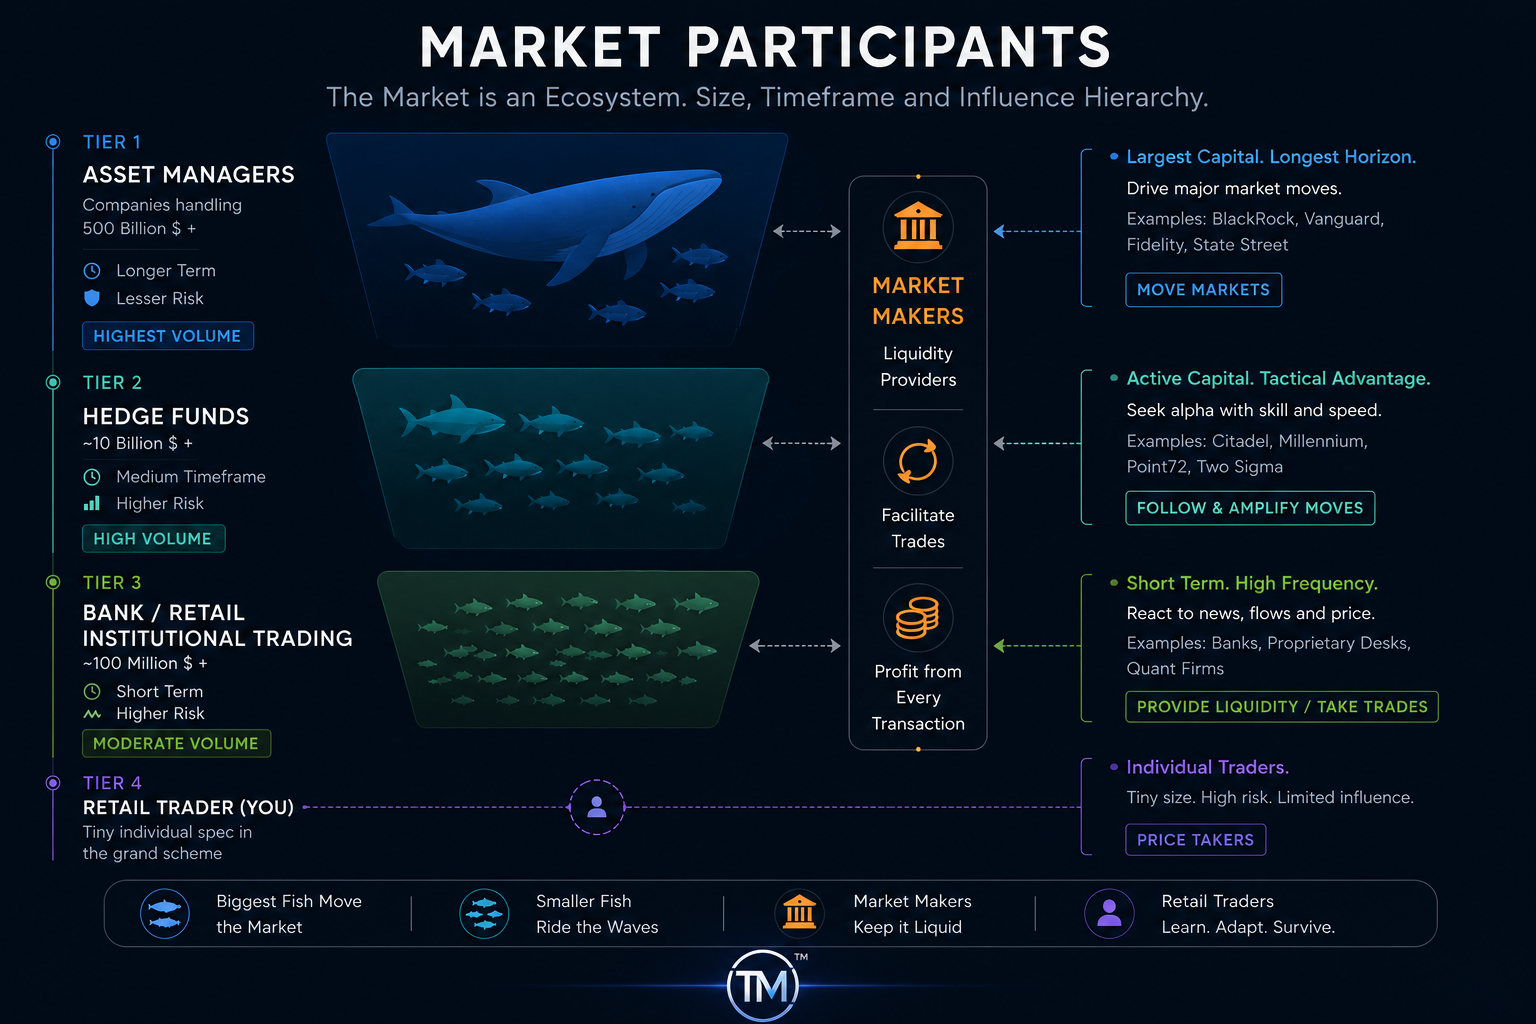
🦈 Tier 1 — Asset Managers (Biggest Fish — Move Markets)
$500B+ capital. Longest horizon, highest volume. They set the current — when they reallocate, everything else adjusts. They cooperate with each other most of the time because it's optimal.
🐬 Tier 2 — Hedge Funds (Smaller Fish — Ride the Waves)
~$10B+. They follow and amplify Tier 1 moves with speed and tactical skill. They cooperate when aligned, defect (manipulate) when they spot retail mistakes.
🐠 Tier 3 — Banks & Prop Desks (Provide Liquidity / Take Trades)
~$100M+. Short-term, high frequency. React to news, flows, and price. They profit from transaction flow — the more volume, the better for them.
🐟 Tier 4 — Retail Traders (You) (Price Takers)
Tiny size, limited influence. We don't move anything. Our advantage: agility. We can observe, adapt, and position in the wake of the big fish — if we understand the game.
🏛️ Market Makers (Keep It Liquid)
Sit in the middle of every tier — facilitating trades, profiting from every transaction. The ultimate responsive players. They want balance because that's where volume lives.
Use the Participants to Your Advantage
- → Observe their methods and movements
- → Observe when they align — and join them. Surf with them.
- → Observe when they compete — step aside, protect capital
- → Observe when retail (Banking Retail) makes mistakes — that's where the big fish feed
Balance vs Imbalance
Markets exist in only two states: Balance (Range) and Imbalance (Trend). Everything else is just detail within these two modes.
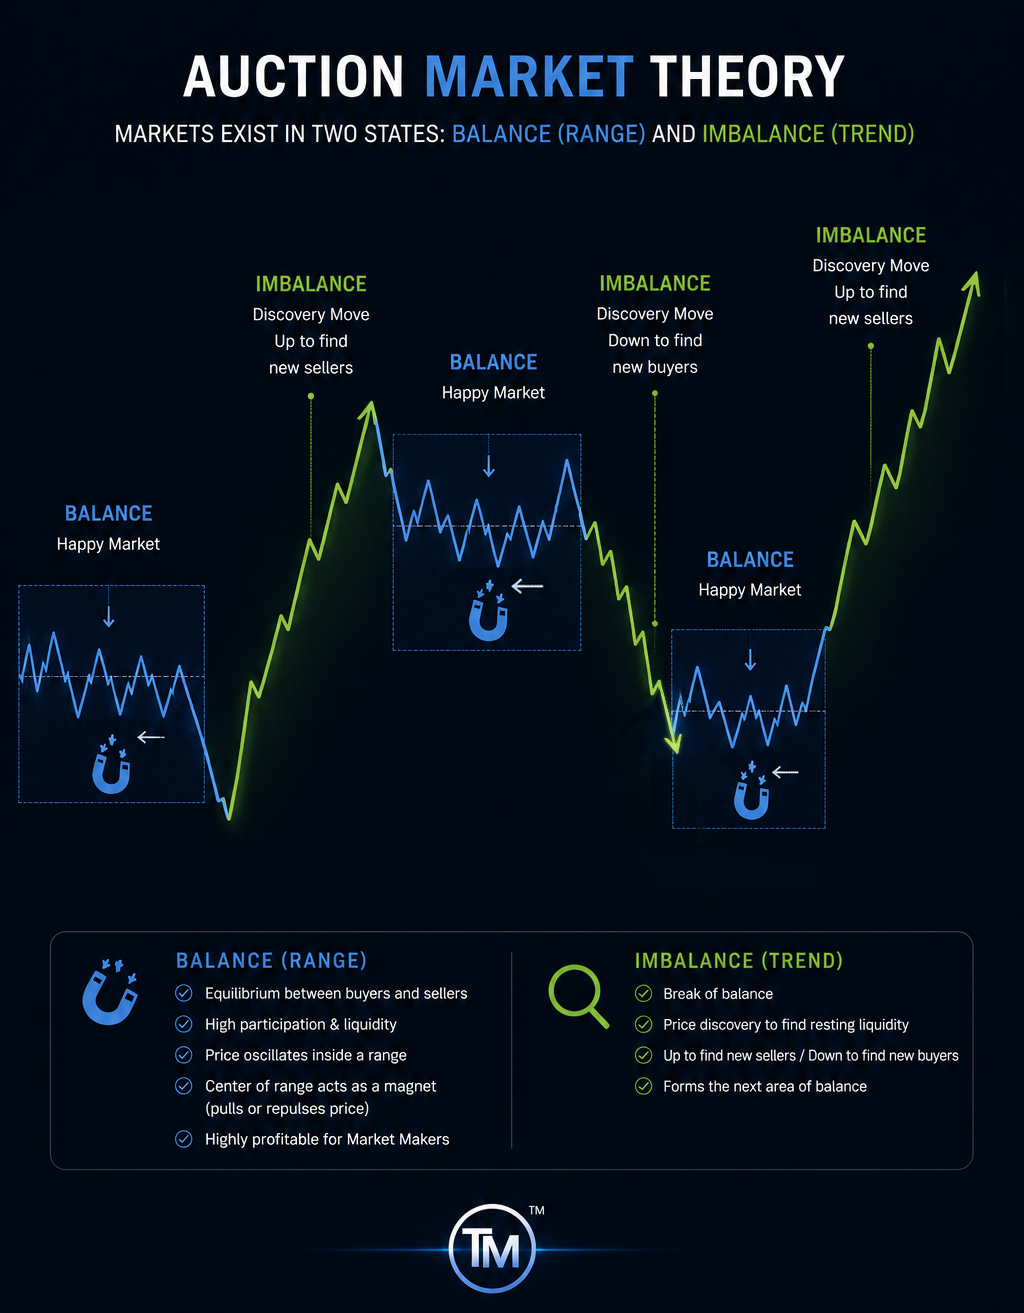
Balance (Range)
- → Equilibrium between buyers and sellers
- → High participation & liquidity
- → Price oscillates inside a range
- → Center of range acts as a magnet (pulls or repulses price)
- → Highly profitable for Market Makers
Imbalance (Trend)
- → Break of balance
- → Price discovery to find resting liquidity
- → Up to find new sellers / Down to find new buyers
- → Forms the next area of balance
The Cycle
The market constantly cycles between these two states: Balance → Imbalance → New Balance. Balance is the "happy market" — where participants agree on value and volume is high. Imbalance is the discovery move — where one side overwhelms the other and price searches for new levels where two-sided trade can resume.
This cycle repeats at every timeframe, fractal in nature. The same pattern on a 5-minute chart plays out on a daily chart — just different participants and different time horizons.
Why This Matters
Every trading decision reduces to one question: Is the market in balance, or breaking into imbalance? In balance — fade the edges or wait. In imbalance — join the discovery move and surf with the big fish.
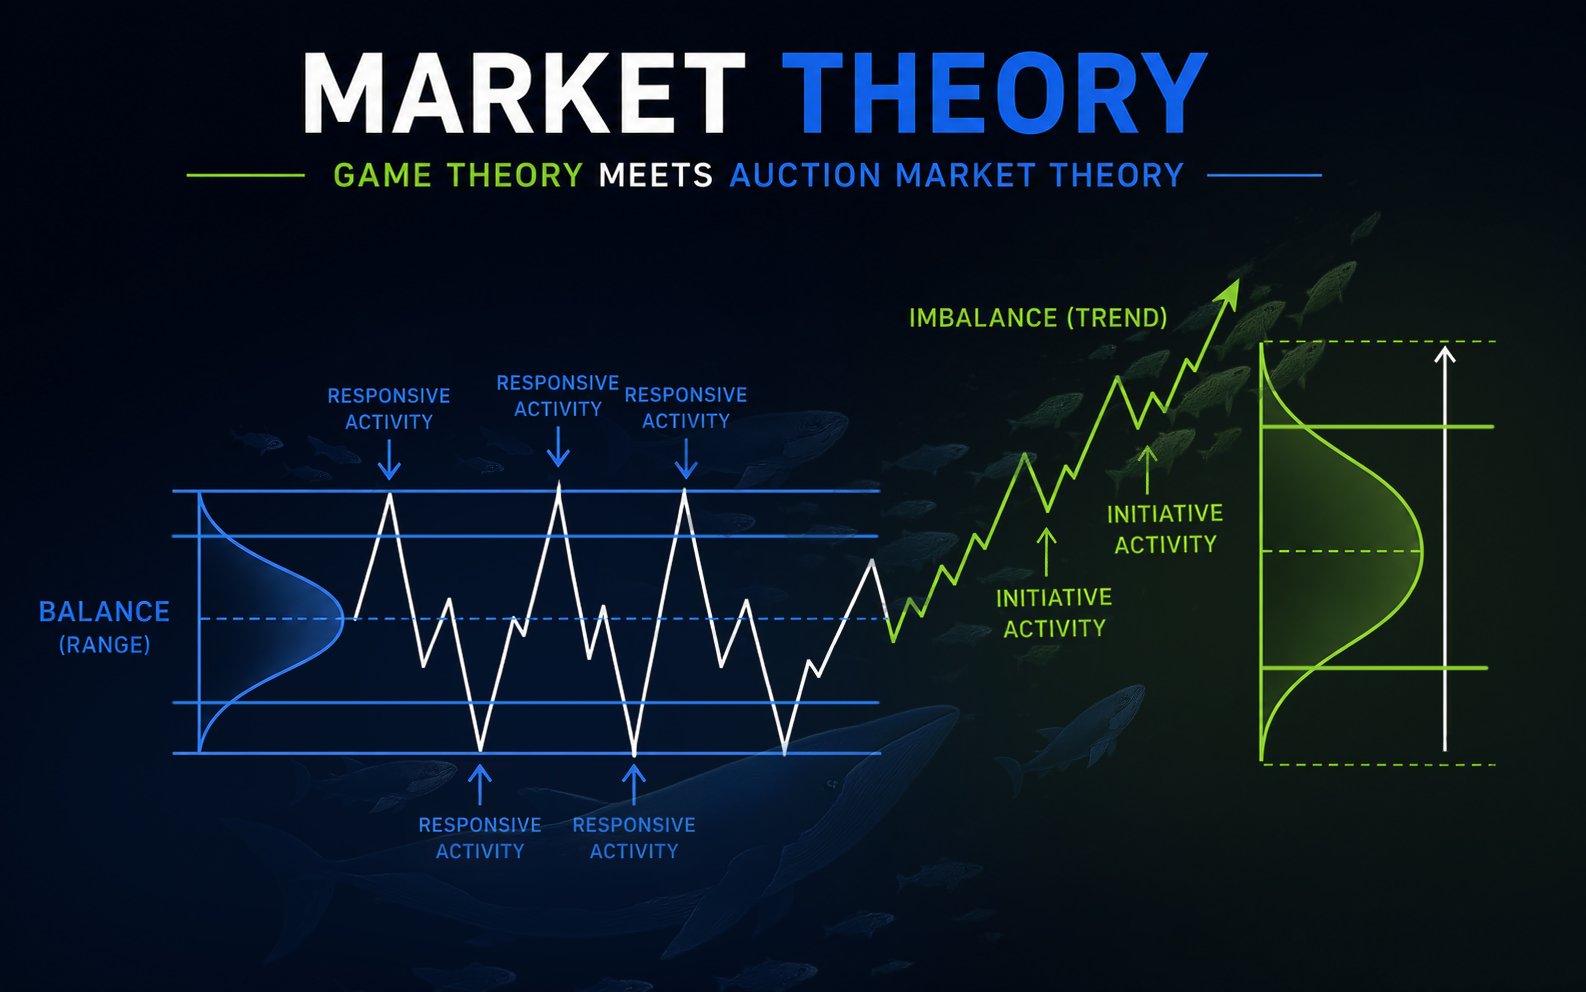
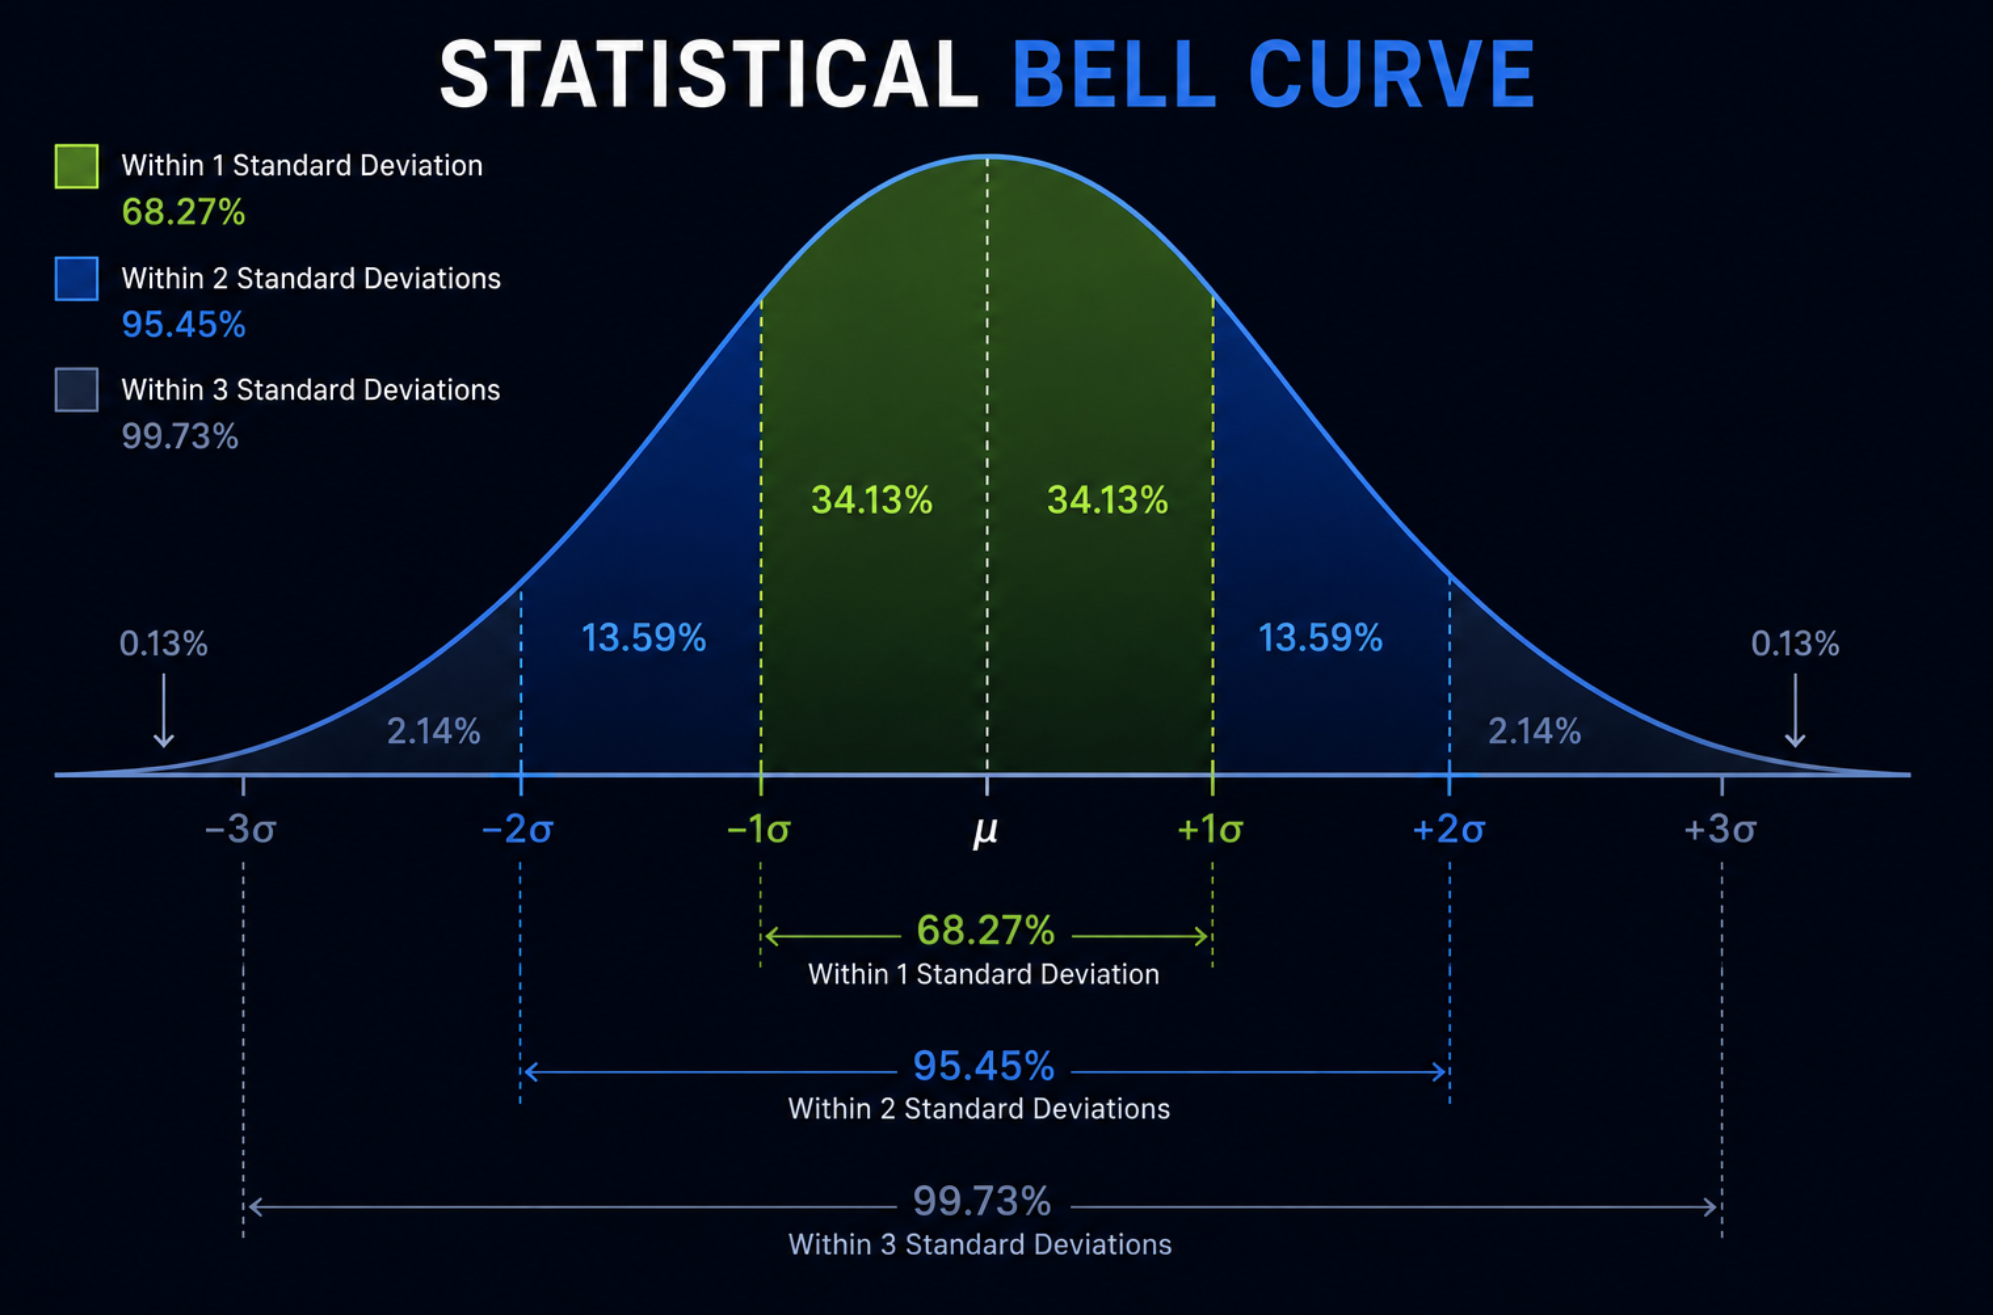
The Bell Curve
Balance creates a bell curve of volume. The fat middle is where most transactions happen — and that's the value area the market has accepted as fair.
The Crowd Behavior Behind the Curve
Auction markets, like any human endeavor, follow the bell curve. Most of the time, crowds return to what they know — the mean, the average, the comfortable price. This is behavioral, not mathematical: humans are creatures of habit, and traders are no exception.
When price explores new territory, the crowd hesitates. When price returns to familiar levels, the crowd participates. The mean — the most traded price — becomes the anchor. Everything else is deviation.
The market profile visualizes this: the POC is where the crowd feels safest. The value area is where they're willing to transact. Beyond the value area, the crowd thins out — prices become exploratory, not accepted.
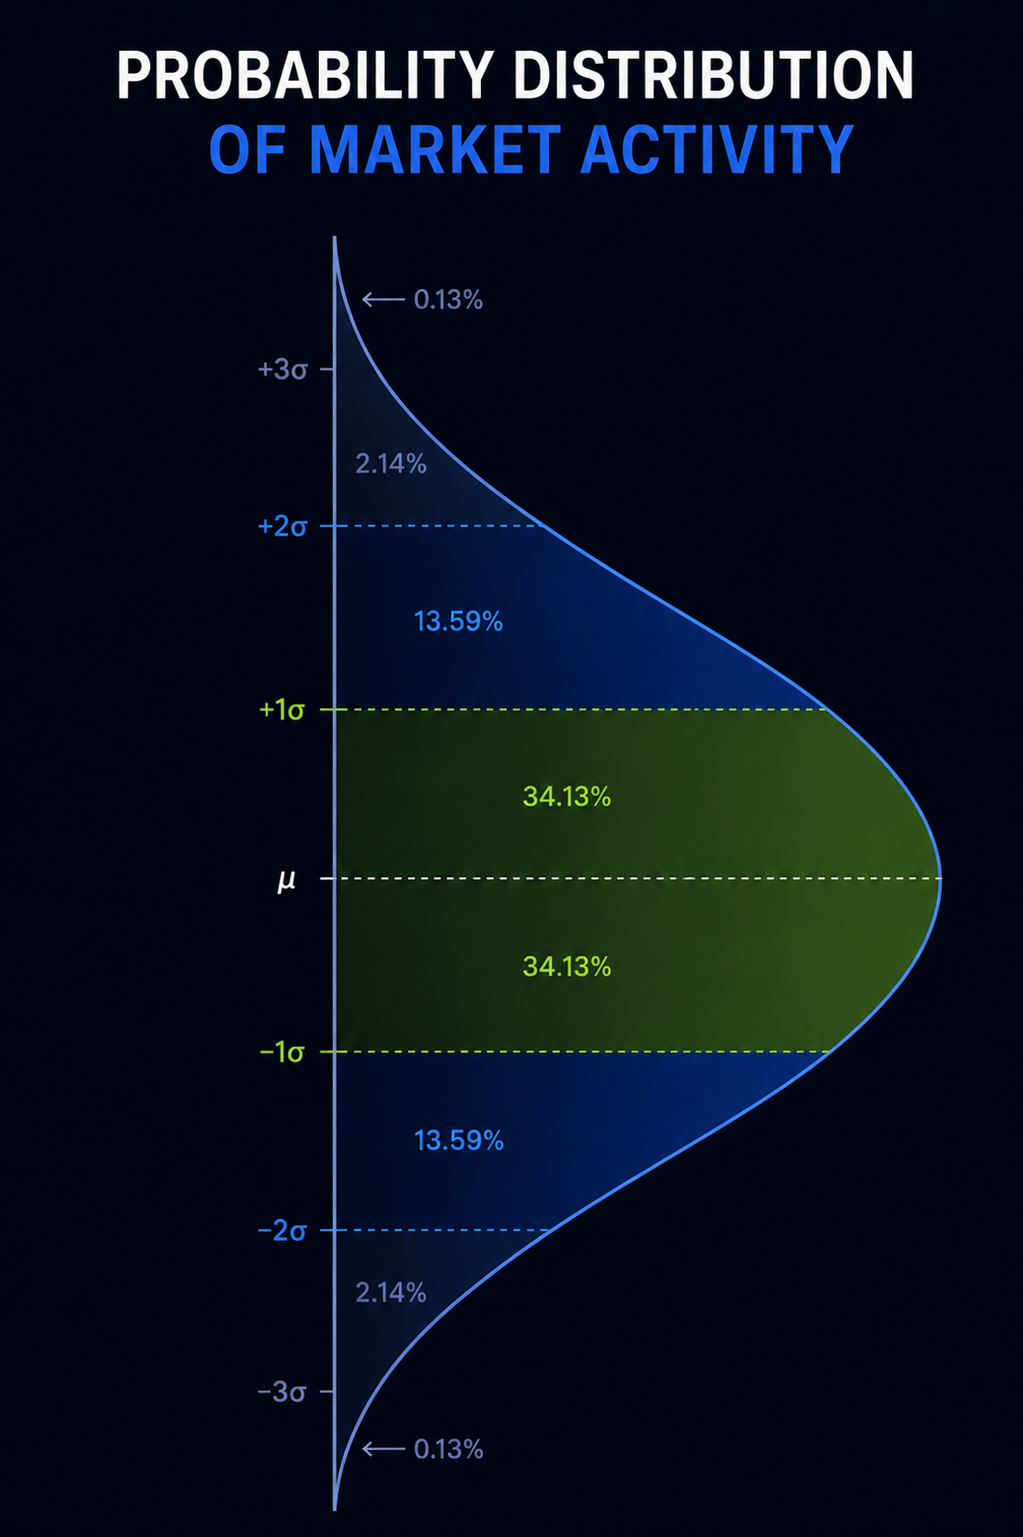
Probability on the Price Axis
Rotate the bell curve 90 degrees and overlay it on price. Now the distribution shows where trading activity concentrates — not when, but at what price levels.
In trading tools, we aggregate this from volume data. Each contract traded is market activity. As we aggregate where that activity happens at specific price levels, these behavioral statistics emerge — creating a clearer picture of market participants than what a price chart alone can provide.
The thick middle is where the crowd feels comfortable. These prices are common — visited often, traded heavily, accepted as fair. The thin tails are rare — extreme prices where few participants engage. When price reaches these outer zones, it either finds responsive players pulling it back, or initiative force breaking through into discovery.
This is the statistical reality behind the auction: some prices are habitual, others are exploratory. Know which zone you're in.
Market Makers Love Balance
Every time price oscillates in a range, market makers collect the spread on both sides. More rotations = more transactions = more profit. They have every incentive to keep price contained. They provide liquidity at the extremes (VAH/VAL).
Institutions Accumulate in Balance
Large players need range to fill their positions without moving price against themselves. Balance is where they build. The longer balance lasts, the bigger the position they're building — and the bigger the eventual move.
The Implication
The bell curve tells me where fair value is right now. When price is within the value area, the market is happy — balance. When price breaks outside the value area with conviction, that's the discovery move — imbalance. The old value area becomes a reference: will it act as support/resistance, or will price slice through?
Responsive vs Initiative
Two forces battle at the edges of value. The only questions that matter:
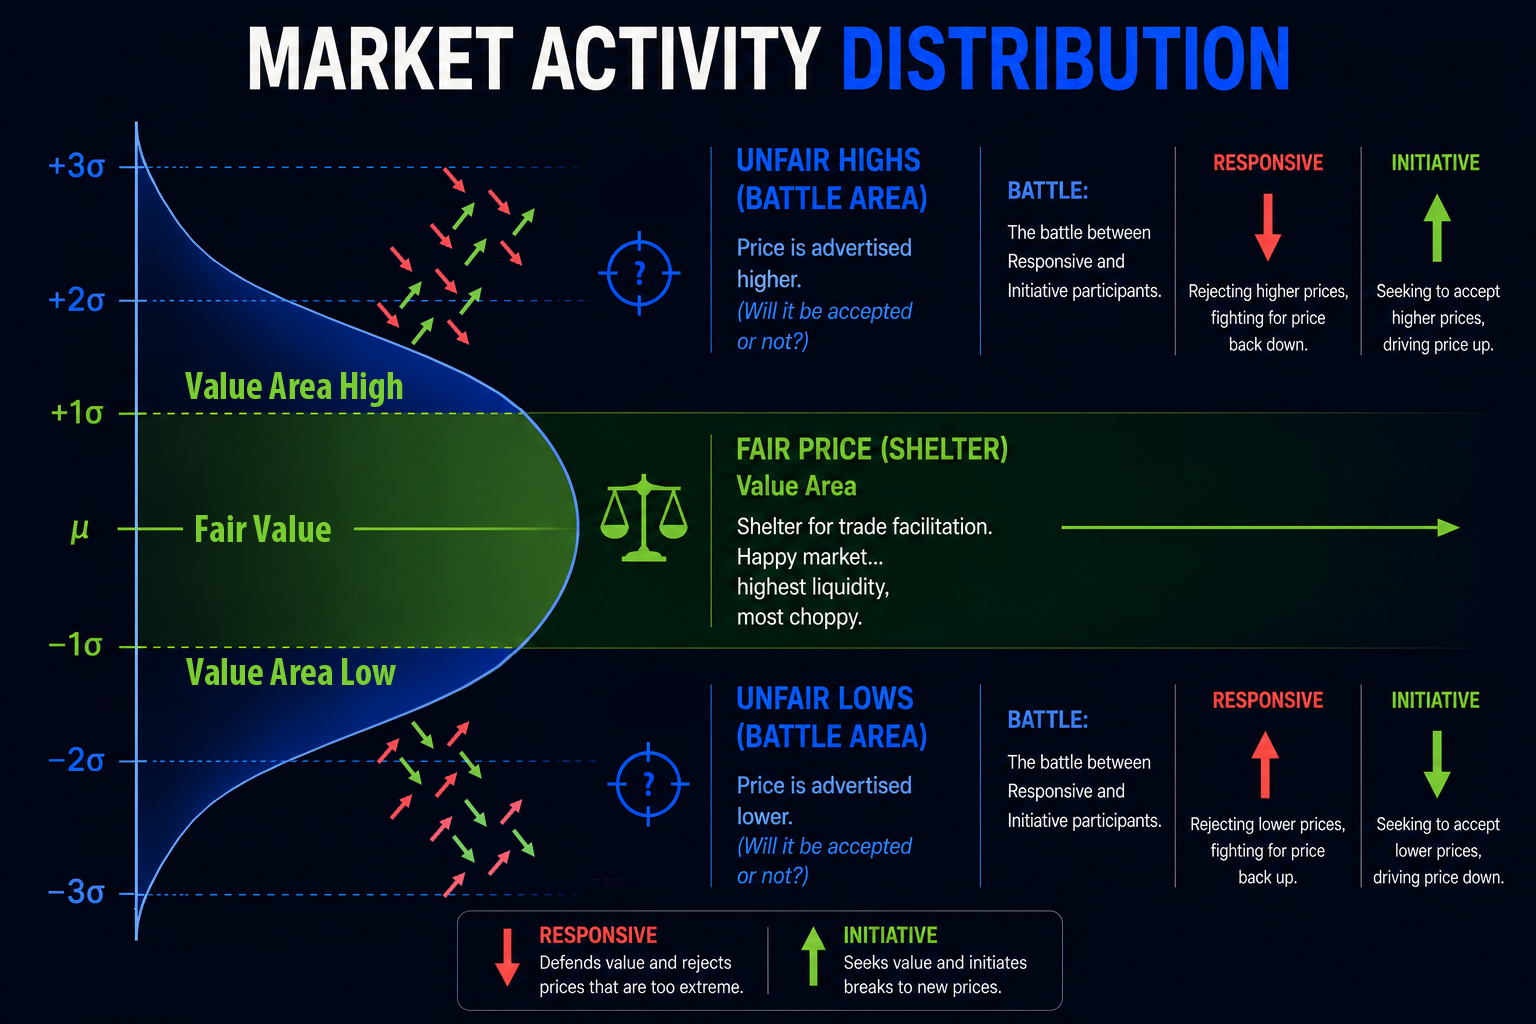
The Read
Where is the battle? Beyond the value area edges — VAH and VAL. This is where responsive players defend the Fair Price and initiative players attack.
Is price accepting? Instead of obsessing over who is fighting, I pay attention to whether price is being accepted in that area. Is price spending time there and trading heavily? That means acceptance, and acceptance confirms direction. On the other hand, if the area is rejected and price quickly moves away, that confirms the opposite path. That's the entire read necessary.
📖 To Be Continued
This section will be expanded with practical examples of reading responsive vs initiative activity in real market conditions, confirmation signals, and entry frameworks.
⚠️ Disclaimer
This content is for educational and informational purposes only and does not constitute financial advice, investment advice, trading advice, or any other sort of advice. The information presented here is general in nature and is not specific to you, the user.
Trading and investing in financial markets involves substantial risk of loss and is not suitable for every investor. Past performance is not indicative of future results. You should carefully consider your investment objectives, level of experience, and risk appetite before making any trading decisions.
You are solely responsible for your own trading decisions. The author is not a licensed financial advisor, broker, or dealer. Never risk more than you can afford to lose.