Probability Simulator
Set any win rate and watch how observed results vary wildly with small samples, only converging toward the true probability with larger samples.
Parameters
The actual probability
Trades per person (slider max 500, type up to 10k)
Same strategy, different experiences
Same seed = same results
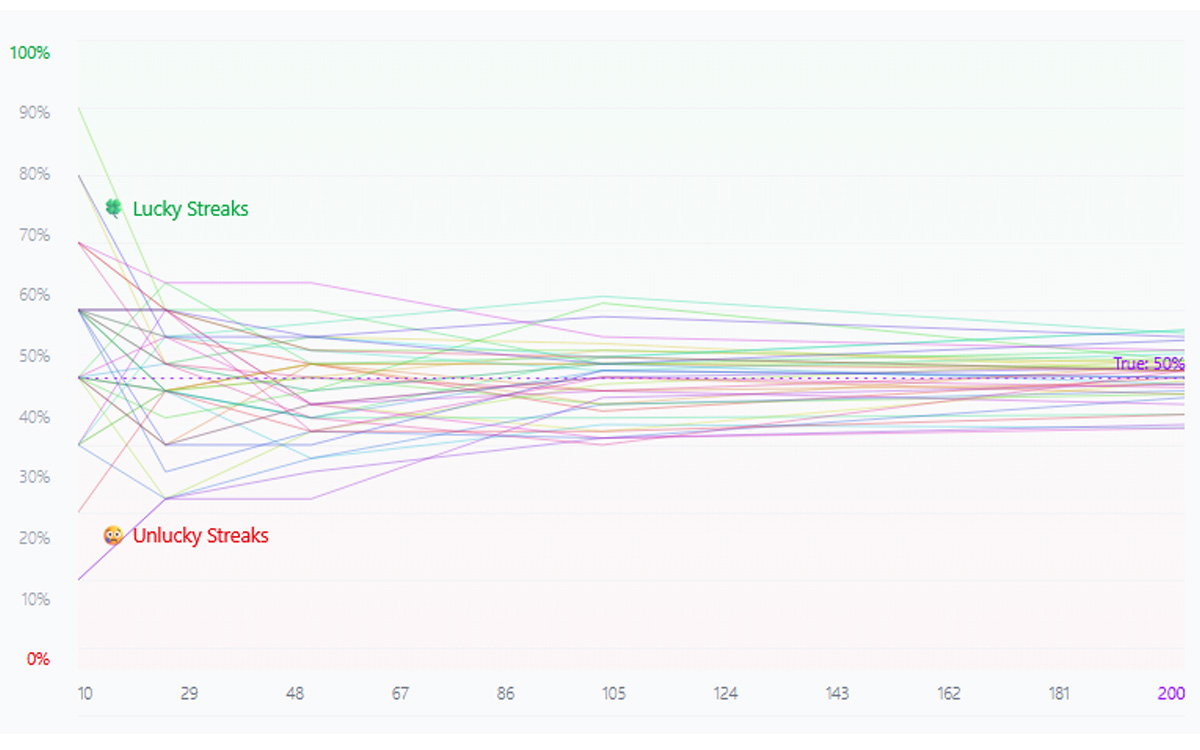
Win Rate Convergence
Imagine each line as one person trading the same strategy. Some start lucky, others unlucky — completely different journeys at the start. Over time the lucky one feels things "getting worse" while the unlucky one feels "improvement." In reality, they're all just converging to the true 50%.
💡 This helps you see luck's fingerprints on unproven edges or abandoning of working edges too early. See how experience of 1 person to another can vary on just 20 back/forward tested trades. From what I've observed, it usually takes 200+ samples before a true win rate starts to reveal itself. Have you even hit 100 yet?
Streak Analysis — The Reality of Luck
Same 50% strategy, different journeys. One trader rides a hot streak feeling invincible while another grinds through losses questioning everything — both are normal. The lucky one's results get "worse" over time, the unlucky one's get "better" — they're just converging to reality.
😢 Unlucky Streaks (Losses)
🍀 Lucky Streaks (Wins)
� Key Insights
- • Early results are misleading — With few trades, one person might feel like a genius while another questions their strategy. Both are just experiencing normal randomness.
- • Convergence takes time — The more trades, the closer everyone gets to the true win rate. Patience reveals reality.
- • Streaks are normal: Losing streaks of 12 and winning streaks of 13 occurred naturally.
- • Sample size matters: Professionals recommend 50-200+ trades to identify a statistically profitable edge. Below that, results can deviate by 20% or more from reality.
Dig Into the Theory
Learn why luck dominates short-term trading results and how to protect yourself.
Read: Luck in Probability →⚠️ Disclaimer
This content is for educational and informational purposes only and does not constitute financial advice, investment advice, trading advice, or any other sort of advice. The information presented here is general in nature and is not specific to you, the user.
Trading and investing in financial markets involves substantial risk of loss and is not suitable for every investor. Past performance is not indicative of future results. You should carefully consider your investment objectives, level of experience, and risk appetite before making any trading decisions.
You are solely responsible for your own trading decisions. The author is not a licensed financial advisor, broker, or dealer. Never risk more than you can afford to lose.