Volatility Risk Management Study
Every day volatility is different, sometimes slightly, sometimes dramatically. Adjusting to it is key. This study is here to help and bring another level of consistency into your trading.
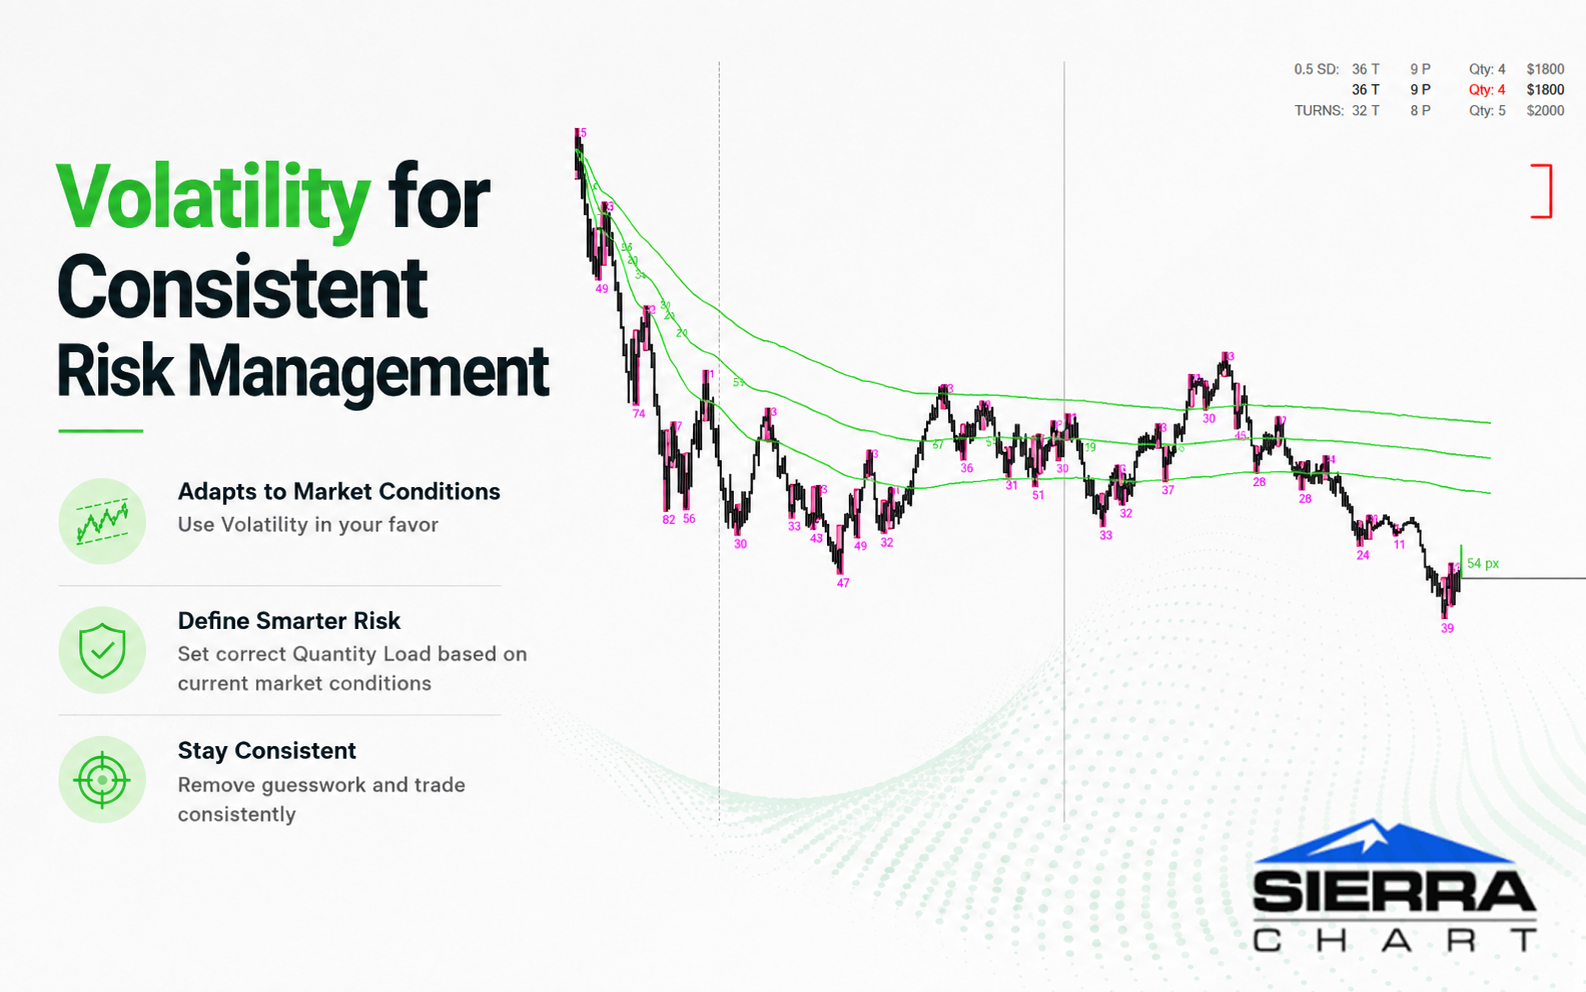
Why Volatility-Based Sizing?
Volatility shifts throughout the day, between days, and across weeks. What works as a safe position size in the morning can be reckless by the afternoon if volatility doubles. What worked yesterday, won't work today. Monitoring these shifts and adjusting your contract load accordingly is a difficult task, but it is one of the most effective ways to stabilize your risk management. Some traders believe, the only thing that matters.
This study measures volatility through two lenses: volume distribution changing during the session and turning points volatility within the current day. Both are excellent yet slightly different real-time reads of volatility in the market that help you scale your contract quantity appropriately and keep risk consistent as conditions and seasons change.
Sometimes volatility gets so extreme that your account simply cannot support even a minimum position safely.Knowing when to skip a session entirely is just as important as knowing how to size within one.
Important to note — this study is built for intraday and hyper-scalping techniques: minutes to hours timeframes, not for higher timeframe use. Turning points volatility also works best on Tick or Volume Bar charts, not on time-based charts.
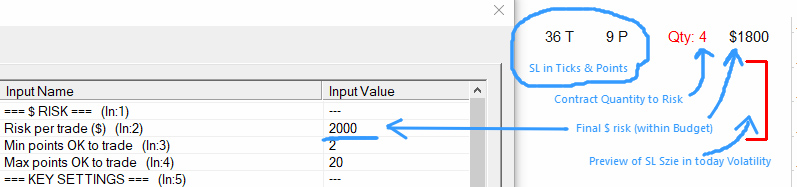
Reading the Study
The study shows your stop loss in ticks and points, the dollar risk per trade within the risk limit you set in the UI settings, and the final contract quantity you can trade within that risk budget. That number is what you use for consistent risk exposure.
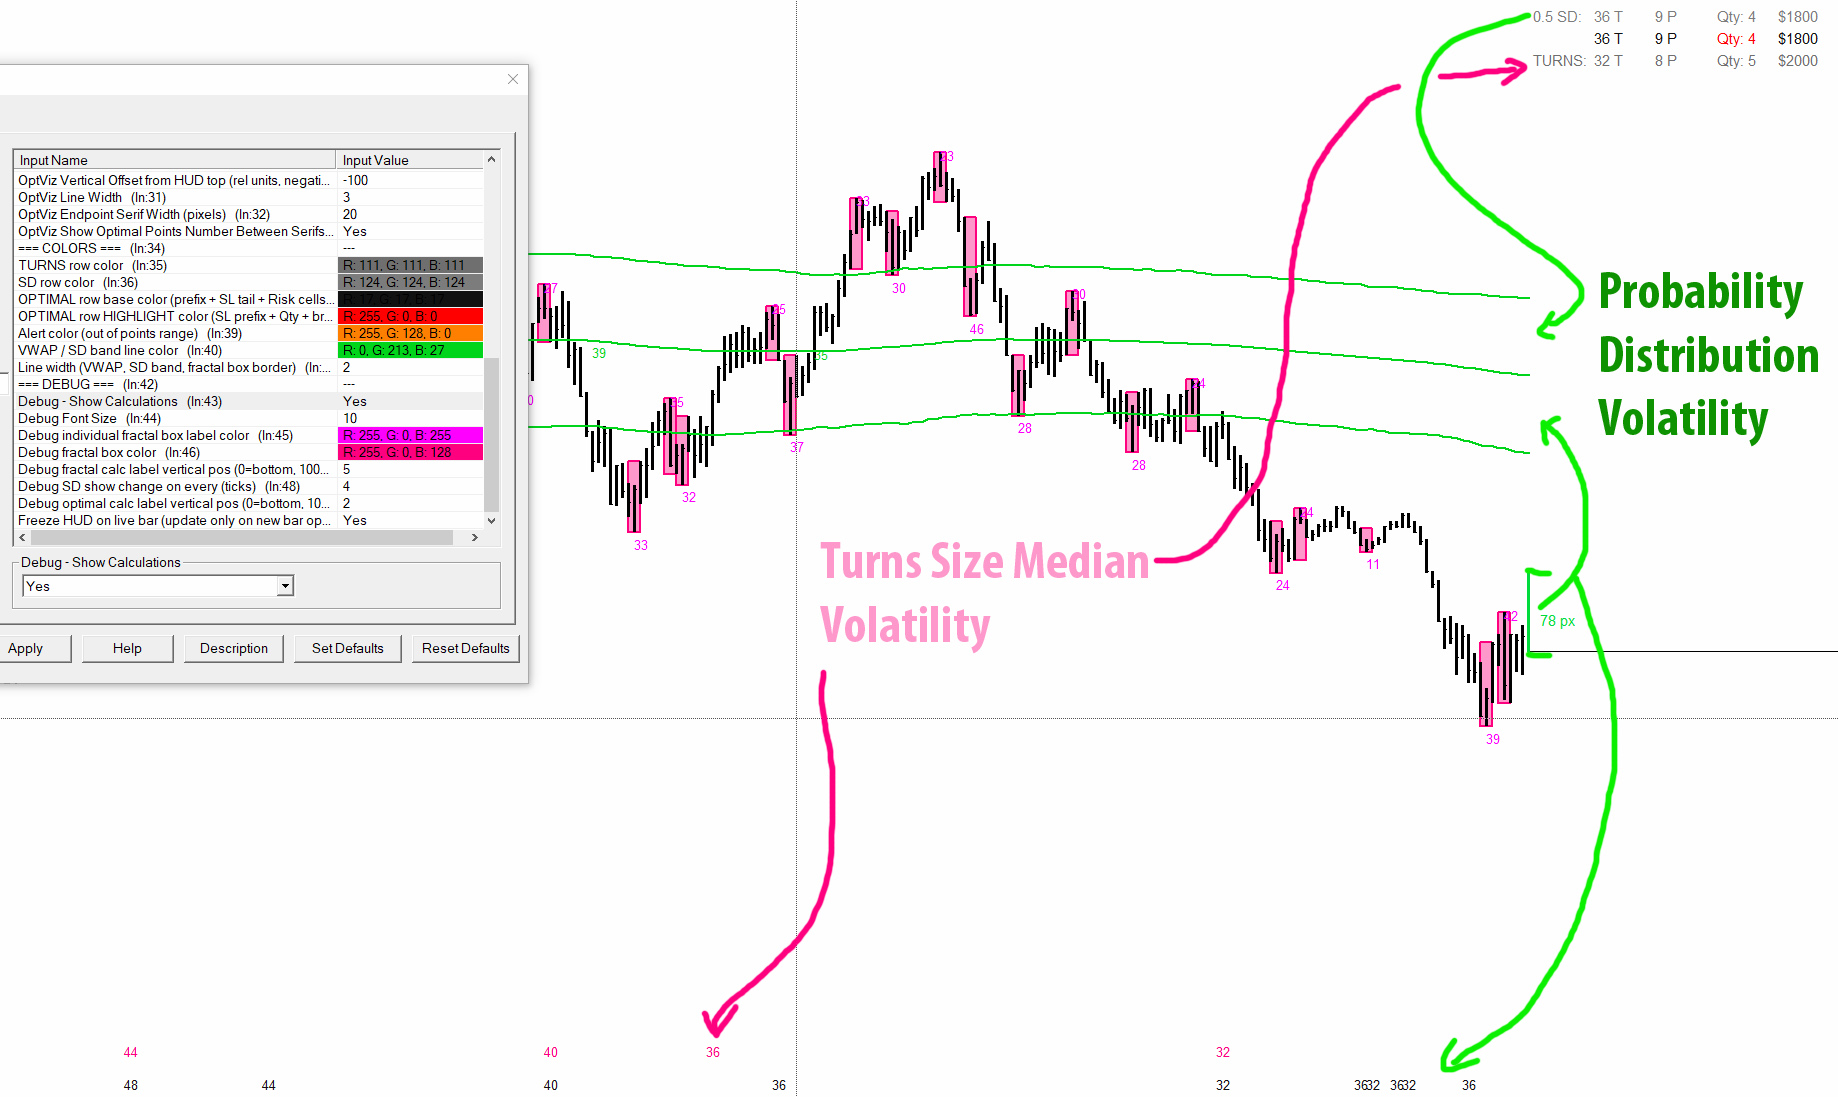
Debug Mode — Fine-Tuning Volatility Measures
With debug mode enabled, both volatility measures become visible for fine-tuning your preferred values: the probability distribution spread and the turning points volatility of recent market waves. These two measures are what the study uses to stabilize dollar risk.
How It Works
Volume Distribution
Tracks average volume-weighted price, which beautifully shows how market orders affect the probability distribution. VWAP is the most widely used tool in professional trading and trading algorithms. Using it to monitor volatility is another excellent use case that very few traders take advantage of.
Turning Points Volatility
Measures the magnitude of turning points — the swing highs and lows within the current session. While many traders use ATR (Average True Range), I fell in love with the turning point measure because it captures the areas we typically trade into, and it creates great balance across both GLOBEX and CASH sessions.
The Study in Action
Applying the Calculated Quantity
Using the study's calculated quantity to size every trade keeps things simple and consistent. At the end of this clip, volatility increases slightly — the next trades would use 4 contracts instead of 5, automatically keeping risk exposure stable without any guesswork.
One of the tools myself and some of my trading friend professionals use daily, despite which session we trade. Some trade premarket like me for about 30 minutes. Others trade market open, through the NY session or GLOBEX session. Volatility is always shifting — growing, shrinking — through the day, through the week, through the month, and even across years. Stabilizing your dollar risk to the conditions in the market separates strategies that work in backtesting from ones that survive long term.
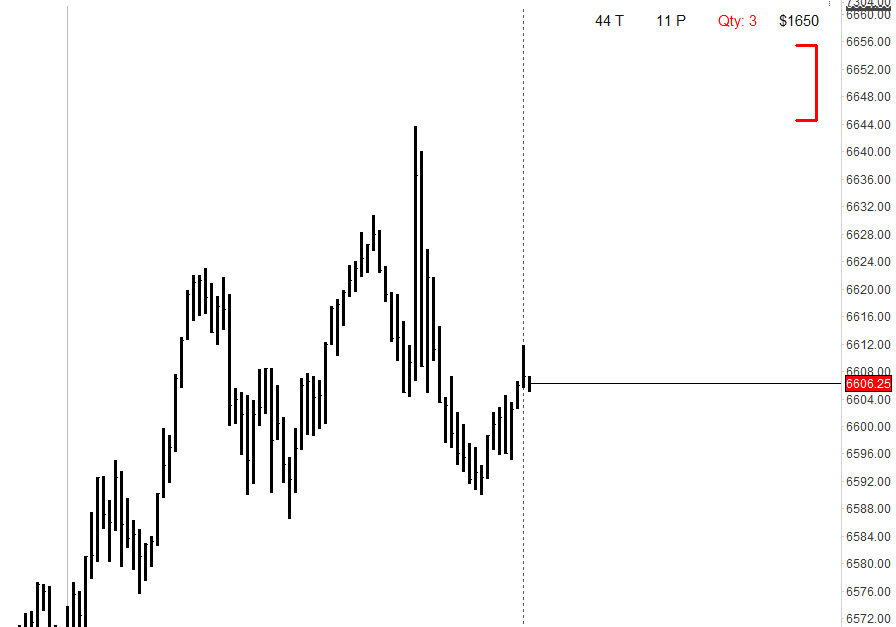
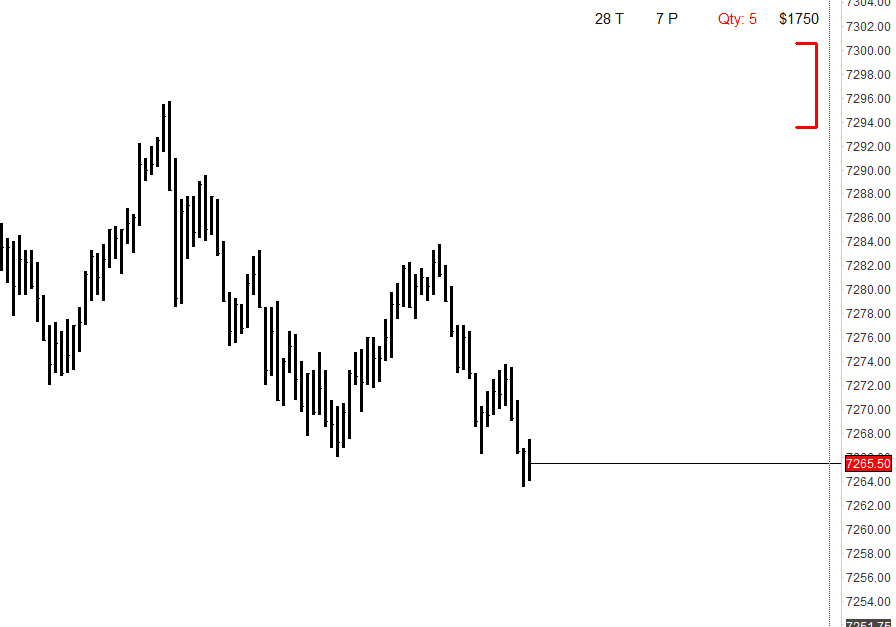
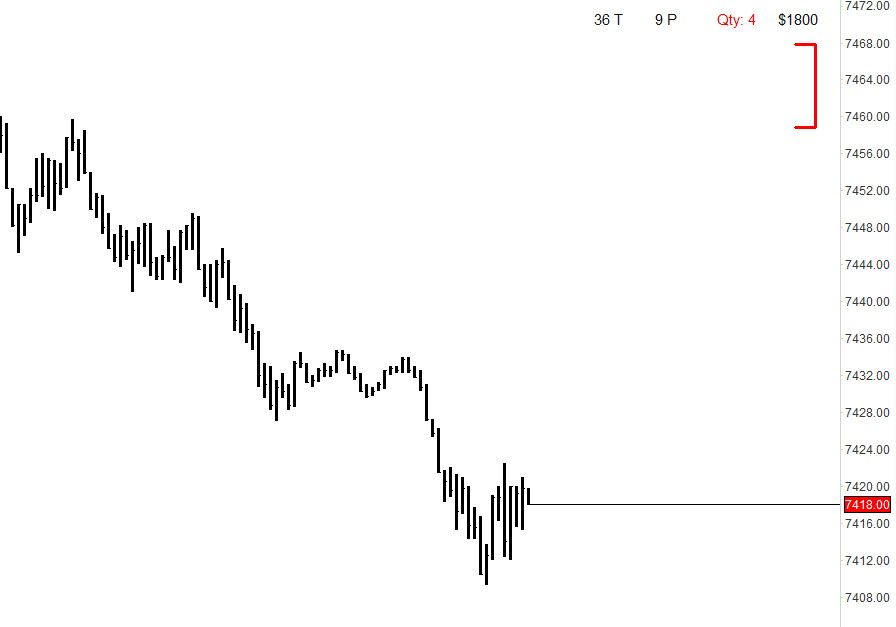
Different Volatility, Adjusted Contract Load, Stabilized Risk
Three sessions with slightly different volatility conditions. When you come to the chart, it can be very difficult to perceive the amount of stretch and contraction in price. You simply cannot trade every day with the same quantities. Different conditions demand proper risk adjustments. Trading a constant number of contracts is not enough. Trading a constant dollar risk is.
Download
Free Sierra Chart study compiled file.
Download Study →Requires Sierra Chart. Compatible with all recent versions.
⚠️ Disclaimer
This content is for educational and informational purposes only and does not constitute financial advice, investment advice, trading advice, or any other sort of advice. The information presented here is general in nature and is not specific to you, the user.
Trading and investing in financial markets involves substantial risk of loss and is not suitable for every investor. Past performance is not indicative of future results. You should carefully consider your investment objectives, level of experience, and risk appetite before making any trading decisions.
You are solely responsible for your own trading decisions. The author is not a licensed financial advisor, broker, or dealer. Never risk more than you can afford to lose.